See how your Google reviews grow over time
Compare review velocity and average ratings across locations. One dashboard, multiple businesses—track trends and spot opportunities.
Multiple locations
Add several Google Business Profiles and compare velocity and ratings side by side on one chart.
Daily to yearly
Switch between daily, weekly, monthly, and yearly views. Toggle velocity or running average rating.
Spot trends instantly
Detect review spikes, slowdowns, and rating changes. Identify what's working and where to focus.
View your data your way
Switch between count, rate, acceleration, and average rating to understand review trends from every angle.
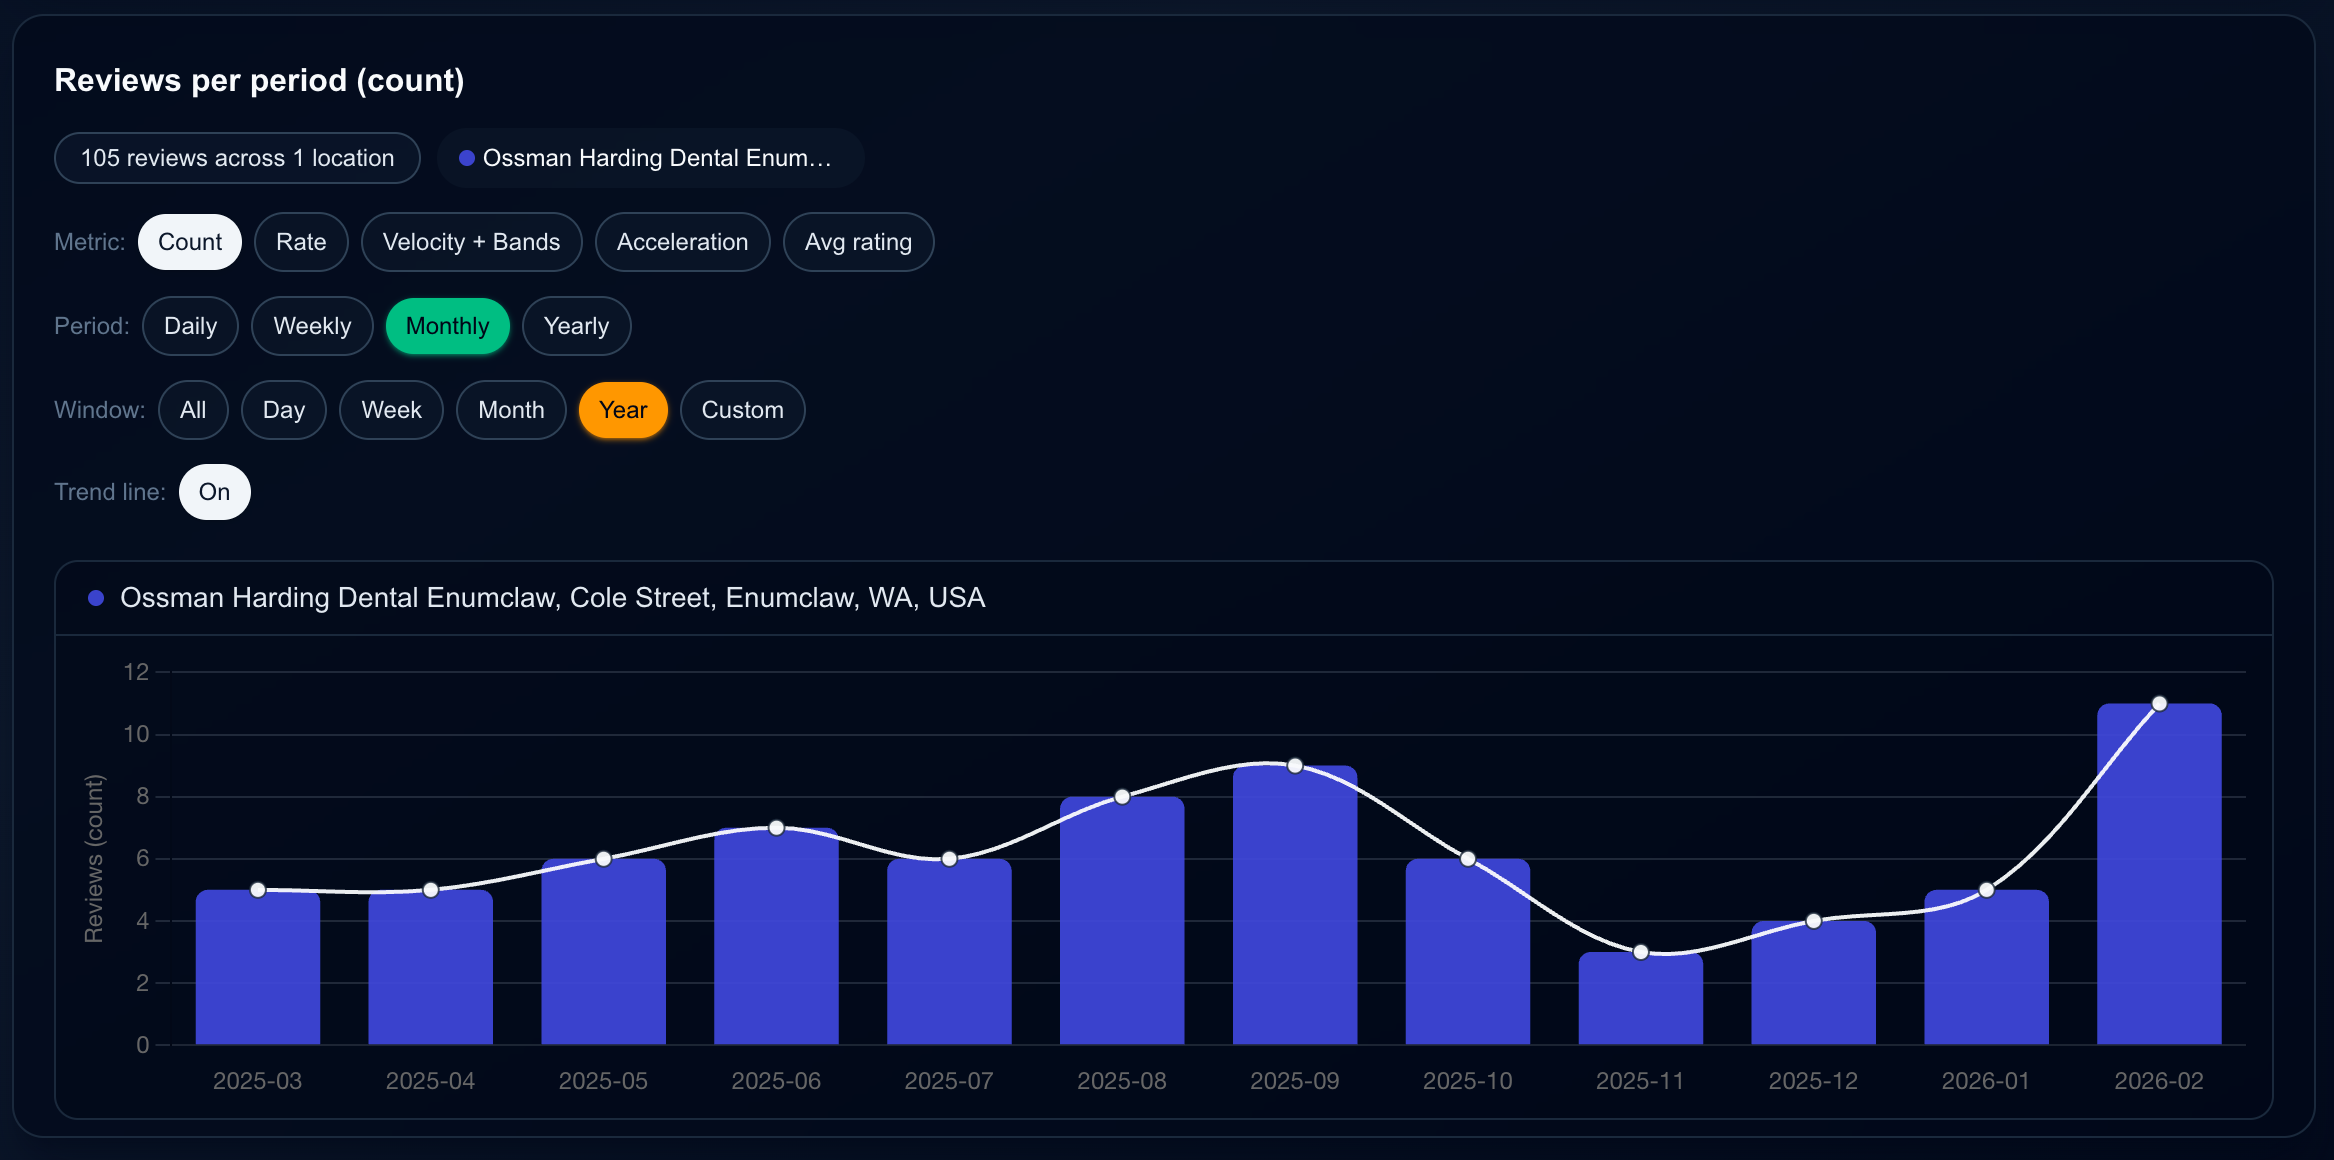
Reviews per period (count)
Bar chart of review count by day, week, month, or year. See how many reviews you received in each period, with an optional trend line to spot patterns.
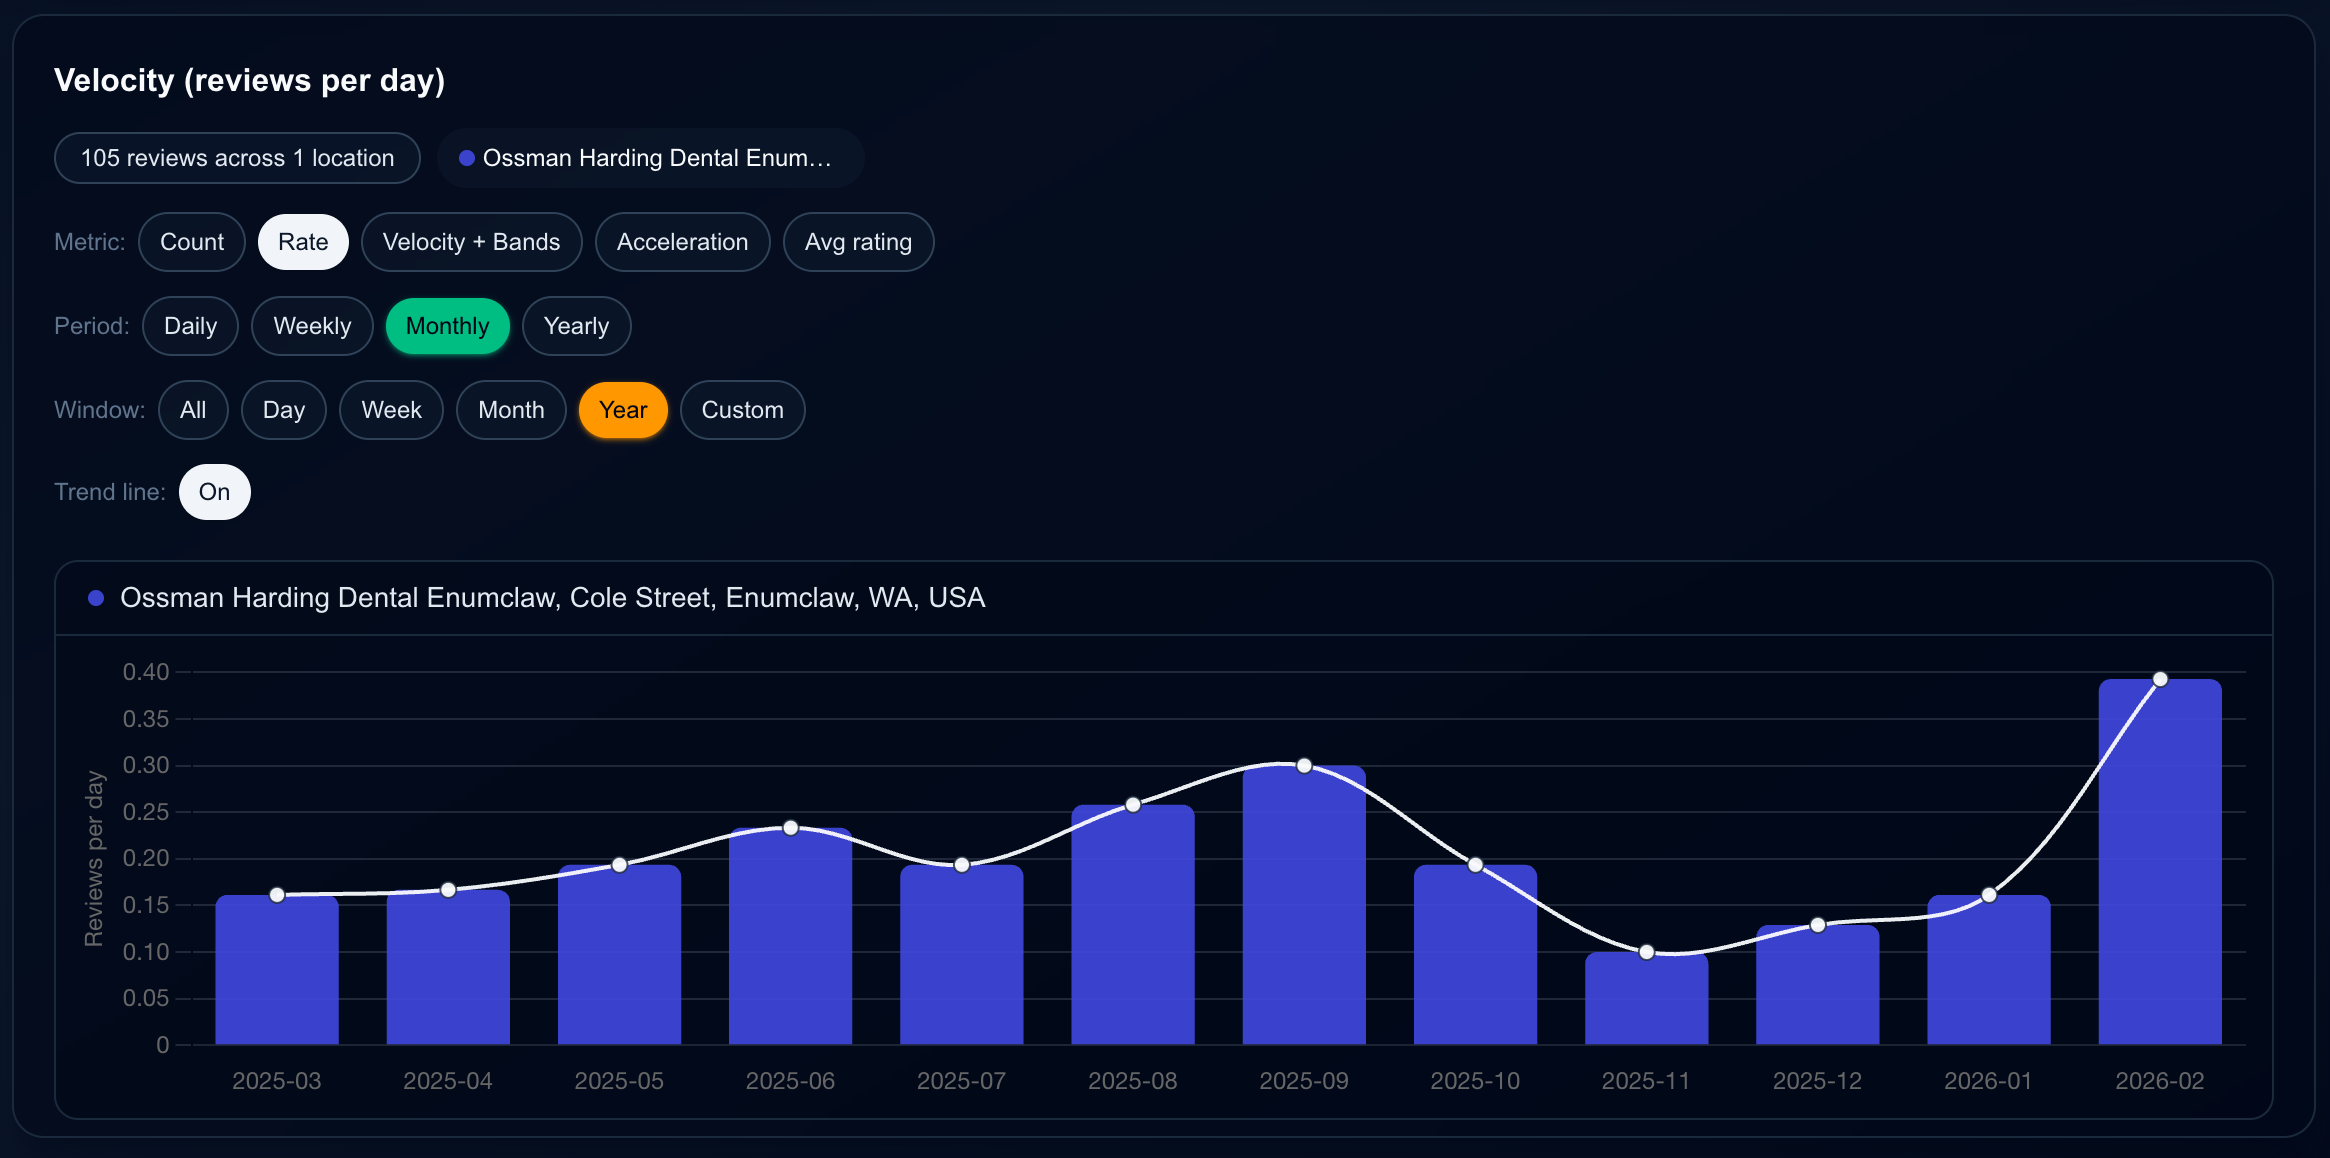
Velocity (reviews per day)
Rate of reviews per day over time. Compare how quickly different locations are gaining reviews and identify growth spikes or lulls.
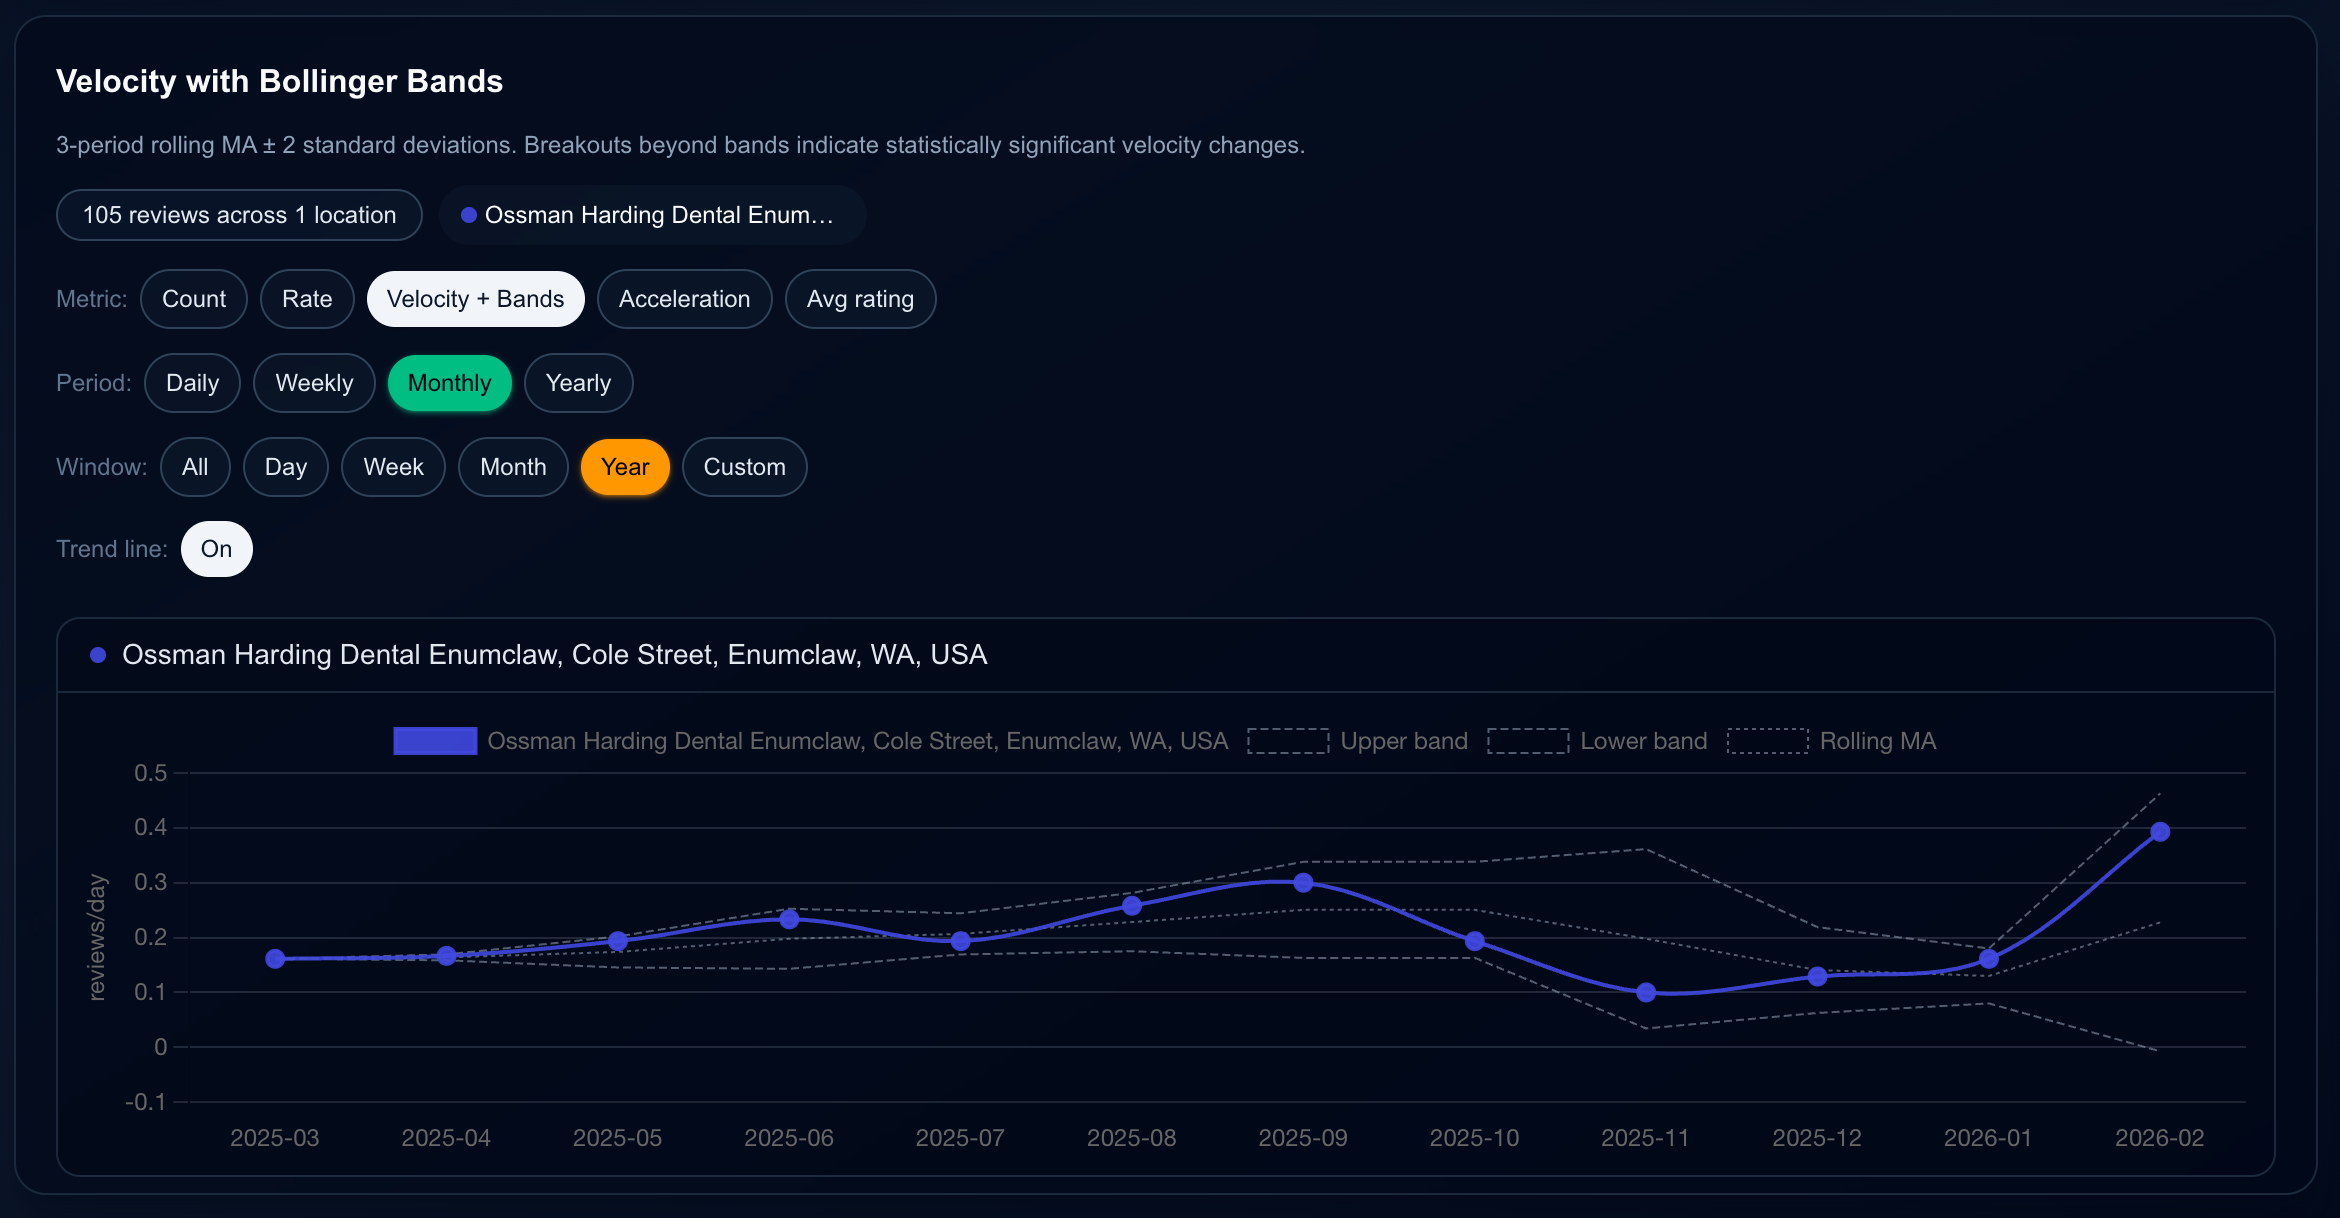
Velocity with Bollinger Bands
Review velocity with a rolling moving average and upper/lower bands. Breakouts beyond the bands indicate statistically significant changes in how fast reviews are coming in.
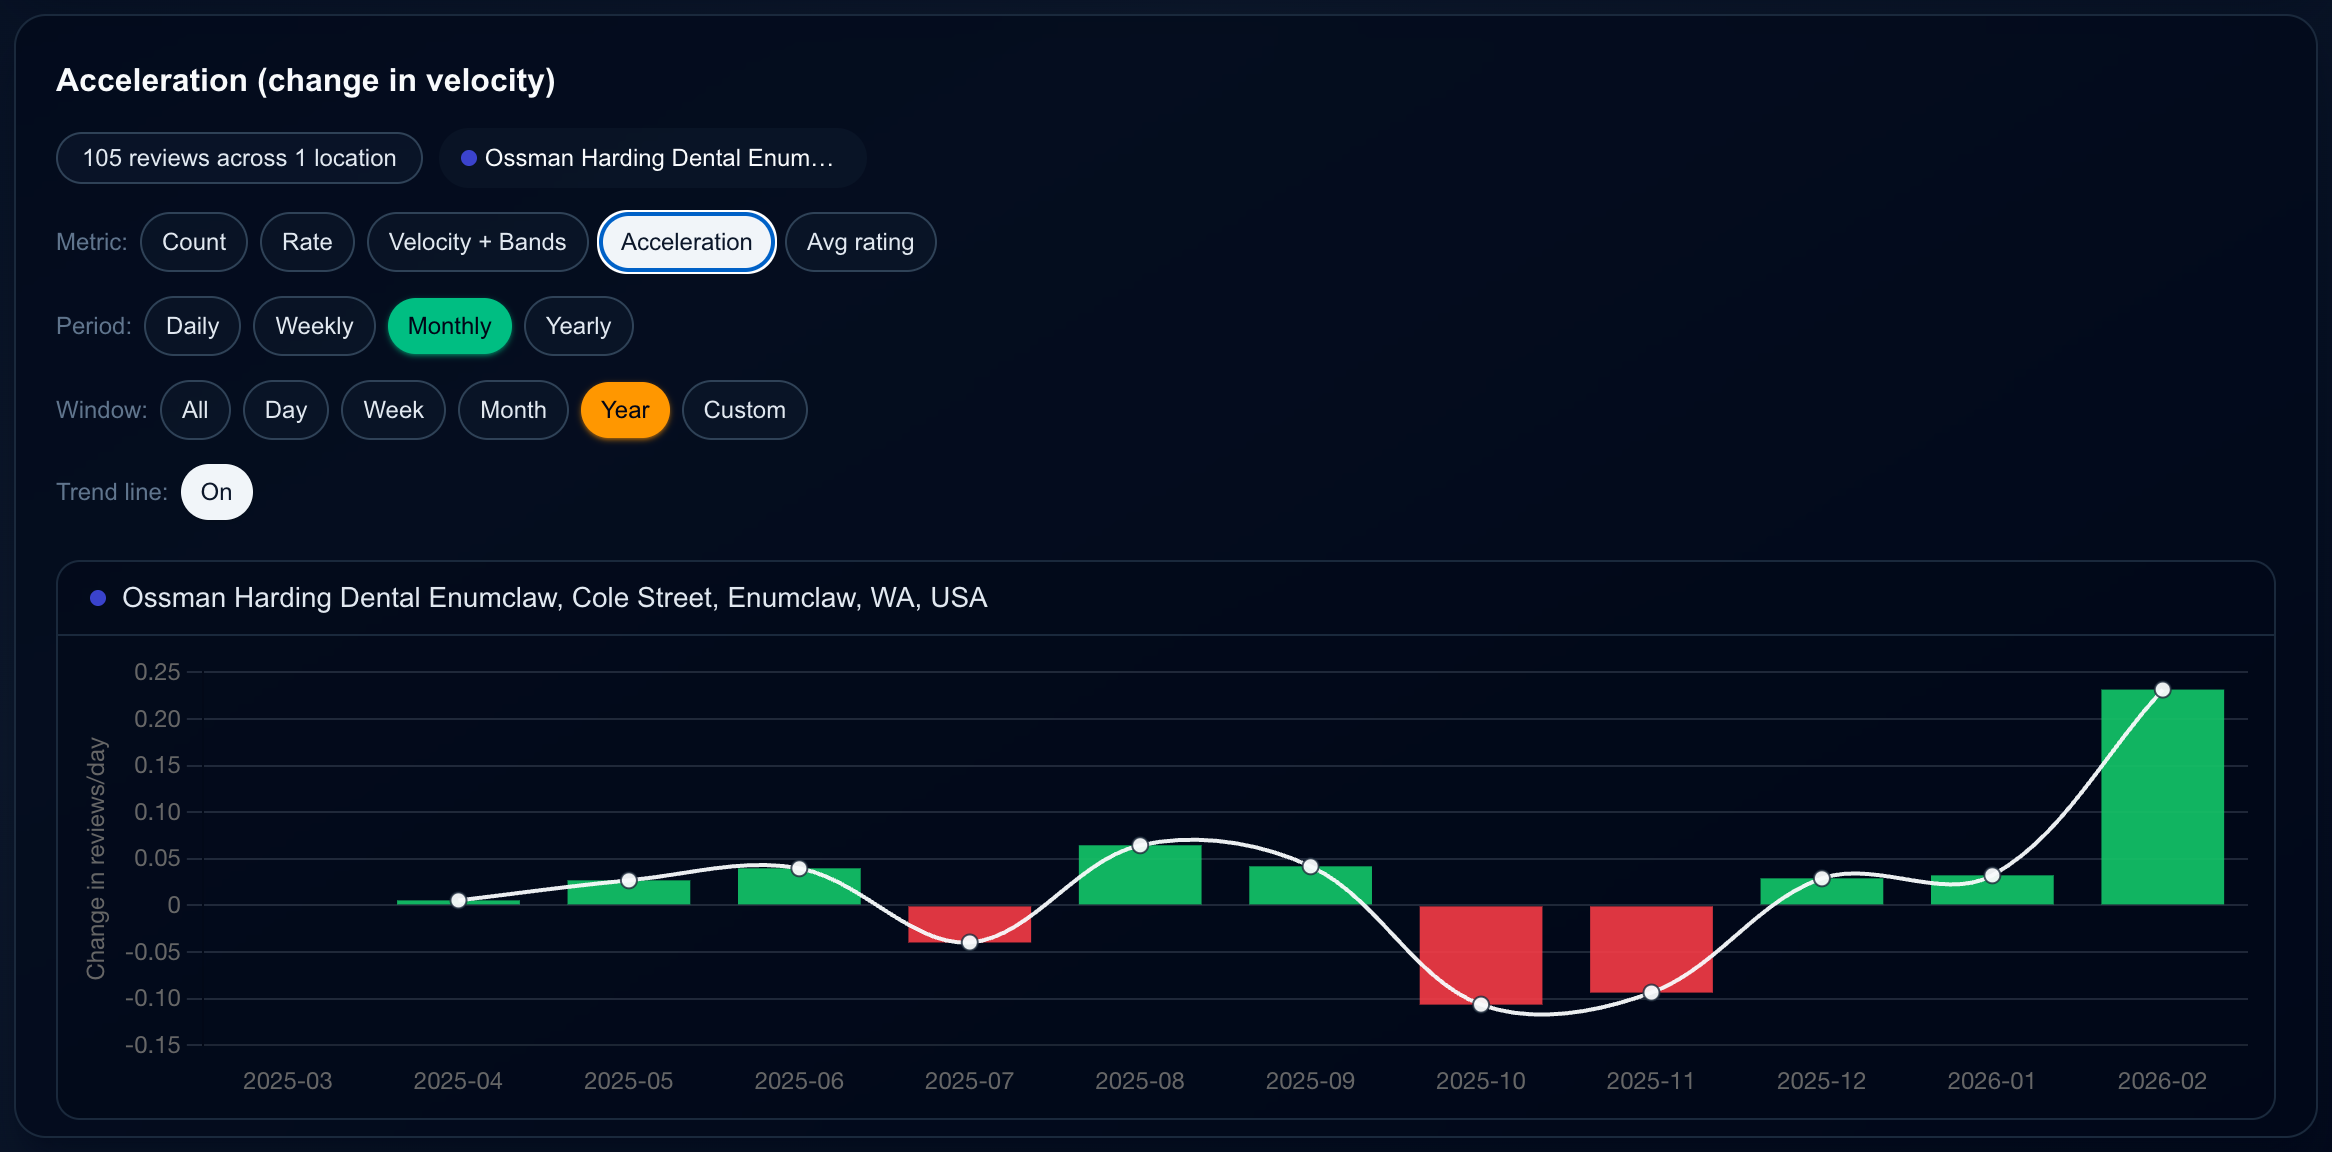
Acceleration (change in velocity)
Month-over-month change in review velocity. Green bars show when growth is speeding up; red bars show when it’s slowing down.
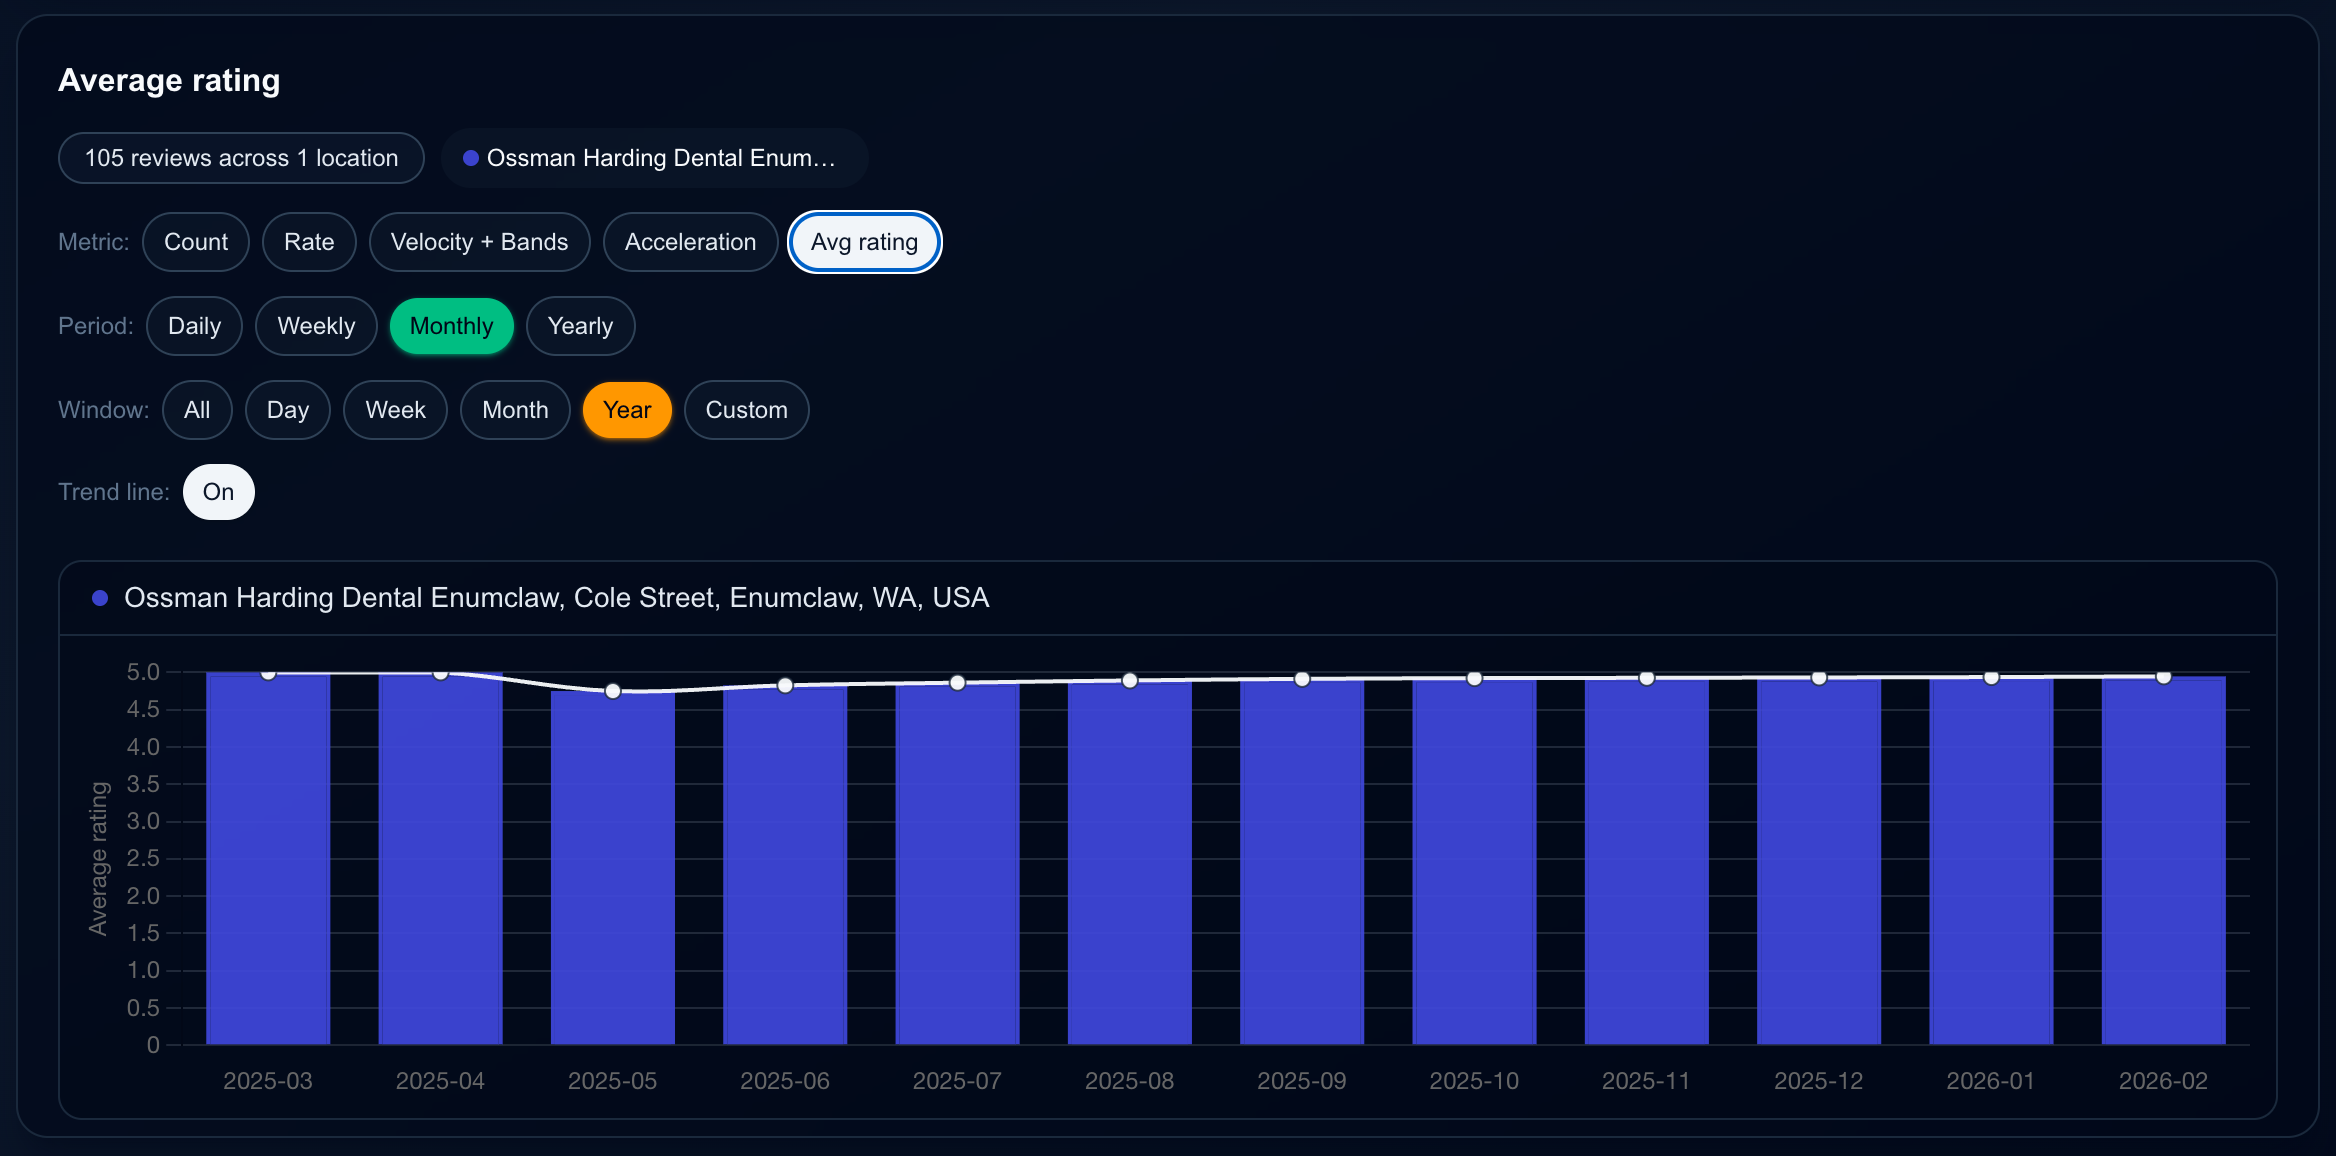
Average rating
Average star rating over time by period. Track whether review quality is improving and spot dips or sustained high ratings.
Already have an account? Sign in to open your dashboard.